ManageEngine
Unified Monitoring for All Your Network Devices, Servers, Applications, and More
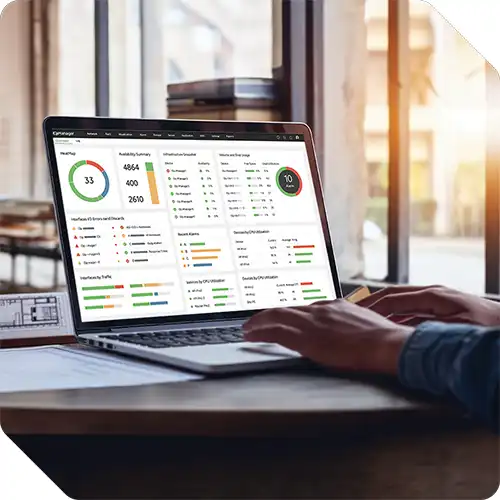
At GWC Networks, we bring ManageEngine to life — empowering your enterprise with real-time visibility across every layer of your IT infrastructure.
What Sets Us Apart?
ManageEngine is powerful. GWC makes it enterprise-ready.
With 100+ built-in monitoring profiles and GWC’s expert deployment, you’ll get:
Unmatched infrastructure coverage
lightning-fast rollout
No blind spots – ever
Device Coverage – What We Help You Monitor
Below is a breakdown of all device types that ManageEngine OpManager can monitor — all of which GWC configures for
automated discovery, alerting, dashboards, and compliance reporting.
01
Network Devices
Routers, Switches, Hubs, Firewalls
Wireless Controllers, Access Points
Load Balancers (e.g., F5, Citrix)
Printers, Scanners, IP Phones
VPN Devices, Edge Gateways
SD-WAN Appliances
Industrial IoT Gateways
02
Servers
Windows & Linux Physical Servers
UNIX Servers (HP-UX, Solaris, AIX)
Virtual Machines (VMware, Hyper-V, Citrix Xen)
Blade Servers & Rack Servers
Remote Desktop Servers
Dell, HP, IBM Hardware Health Metrics
03
VoIP & WAN Monitoring
IP Phones (Cisco, Avaya, Polycom)
VoIP Call Path and Quality Metrics
WAN Link Performance
Jitter, Packet Loss, MOS Score Monitoring
04
Virtualization Platforms
VMware ESX/ESXi
Microsoft Hyper-V
Nutanix AHV
Citrix XenServer
KVM
05
Storage Devices
SAN & NAS Devices (NetApp, EMC, Dell, HP)
Tape Libraries
Storage Switches
RAID Controllers
06
Applications & Services
Microsoft Exchange, IIS, SQL Server
Oracle DB, MySQL, PostgreSQL
Active Directory & LDAP
Apache, Tomcat, WebLogic
SAP, IBM AS/400
DNS, DHCP, FTP, SNMP, WMI-based Services
07
Cloud Infrastructure
AWS EC2, RDS, S3 Monitoring
Microsoft Azure VMs, SQL, Storage
Cloud App Integration via REST APIs
Hybrid Environment Dashboards
08
Environmental Devices
UPS Units (APC, Emerson, Eaton)
Power Distribution Units (PDUs)
Data Center Cooling Systems
Temperature Sensors
Unified Monitoring Features
– Built for Scale
Auto Discovery & Classification
Scan & classify 1000+ devices in minutes
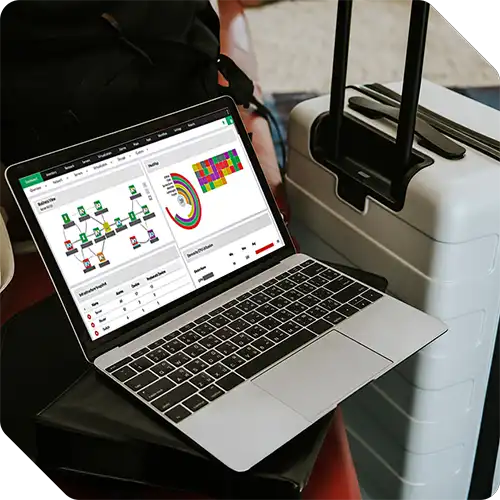
Layer 2 Maps
Real-time topology views with drag-and-drop layout
SNMP, WMI, CLI Support
Broad protocol compatibility
Custom Device Templates
100+ vendor profiles prebuilt; add your own

Advanced Monitoring Capabilities & Ecosystem Integrations
Reporting, Alerts & Automation
Multi-level Thresholds and Alert Escalations
SLA Dashboards by Device or Site
Business View Reports
Scheduled PDF/CSV Exports
Workflow Automation (e.g., auto-restart service on failure)
Seamless Integrations
Helpdesks: ServiceDesk Plus, Jira, ServiceNow
Collaboration: Microsoft Teams, Slack, Email & SMS
CMDB & Inventory Management
Cloud Services: AWS, Azure, GCP
NCM, NetFlow Analyzer, Firewall Analyzer, and more
Our Value-Added Solution Pack
Implementation Roadmap
Tailored for enterprise scale
Network Monitoring ROI Calculator
Build your business case
Top 25 Devices Preconfigured for UAE Enterprises
Localized templates
ISO & NESA Compliance Alert Mapping
Monitoring Success Kit
All dashboards + SOPs
SLA Tracker Excel + Weekly Reporting Template
Real-World Case Study
A Large Retail Conglomerate in UAE
Monitored over 2,500 endpoints including POS terminals
Reduced ticket volumes by 60% with proactive alerting
Integrated OpManager with ServiceNow & NetFlow Analyzer
Achieved NESA compliance through prebuilt rule mapping
Who Should Use This?
IT Managers needing multi-vendor, multi-device visibility
Enterprises with hybrid cloud/on-prem deployments
CIOs & Network Architects looking to scale monitoring
SMEs ready to upgrade from legacy tools
Ready to Deploy ManageEngine the Smart Way?
GWC Implementation Packs Include:
Contact us
Begin Your Next Chapter with Us
We are here to answer any question you may have. Feel free to reach via contact form.
info@gwcnetworks.com
Dubai – UAE
+971.4.2583712
Gurugram – INDIA
+91.9971948511
+91.7042079169
Delhi – INDIA
+91.9971948511
+91.7042079169
New York – USA
+1.860.3278430